

Years ago, a well-known American investment company conducted a study which attempted to explain how returns of long-term financial investments, over the years, converge towards the mean.
The period of time examined was 1972-2001, thirty years spanning across the best moment to invest in 1972 vs. investing in the worst moment of 1972, at the beginning of the year vs at the end of the year. According to the study, timing led to negligible differences in average annual yield (if I remember correctly, yields were between 15.1% and 15.7%, different times for the financial markets).
Outside of the fact that a difference of 0.6% per year for thirty years is a lot of money, the thing that made me most furious, and you’d think they’d have done the study with at least a crumb of intellectual honesty, was that in 1974, two years after the starting period of review, the stock markets lost 50% of their value, creating a huge opportunity for investors, which would have allowed them to realize very different long-term returns.
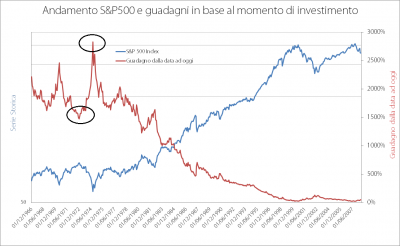
In the above graph, which I admit is not very intuitive (but worth making a small effort to understand), the red line (right scale) represents the percentage of gains that would have been made by investing from that date (x-axis) to today. Those who invested in the best month of 1972, today would have gained 1720%, while the luckiest of 1974, today would have gained 2825%. An abysmal difference considering the average annual return of the former was 7% against 8.9% annual average of those who invested in 1974.

After some much-needed checking, I realized the study wasn’t wrong in declaring that returns over the long-term tend towards the mean, and that the more time passes, the more the average annual return difference thins out (blue and red lines). What actually diverges is the capital available to the investor (green and purple lines), which is what matters most.
Provocatively, at the beginning of my e-book, I placed a graph that represents two hypothetical investors: an unlucky one investing for one year where the market loses 50% of its value, and a lucky one investing the following year, who doesn’t lose 50%. Ultimately, they are investing in the same market so future returns are the same, therefore the trend over time is the same.
Too bad the graph is on a logarithmic scale, because if we placed the graph on a normal scale, things would change. Year by year as the difference in returns narrows, the difference between capital available always tends to increase: this is why timing is and being able to maintain losses within certain limits are essential for not thwarting any future opportunities.
All of this is to introduce a topic we will face later, that is, is there such a thing as a best time to invest? And if so, how can we intercept it to avoid very expensive mistakes?
I invite you to subscribe to this blog so you don’t miss out on the next posts. The window of time for investing is a topic that will change your way of approaching financial markets, it promises to establish a new paradigm in the world of asset management.